Dashboards, Reports & Data Visualization
Creating Understanding with Data Visualization
Data visualization dashboards create understanding around the measurements businesses need to make informed decisions. Oftentimes, they help leaders make sense of complex data that would otherwise be opaque to all but the most experienced analysts.
Data Overload
With advanced data measurement tools like Google Analytics, Qualtrics, Survey Monkey and others, organizational leaders can gather more accurate data than ever before. But humans have a natural limitation to the amount of information we can process at any given time. Consequently, despite having the best measurement tools available in human history, we face:
Overwhelming Amounts of Data
Data that is Fragmented in multiple locations behind different logins
A lack of standardization in presentation format and terminology between platforms
Inability to identify trends or meaningful Patterns
Data Dashboards
Our data visualization dashboards solve for this overload by presenting data in charts and graphs that tell a story that is easier to digest. Clients hire us to pull data from multiple sources into a single, easy-to-access report that they can review in minutes, not hours. They are often surprised by the level of interactivity available in modern dashboards, including date ranges, drill down, group segmentation, and more.

Everything in one place.
Data Dashboard Applications
Modern data dashboards aren’t limited to website analytics and marketing—we have capabilities to help clients generate meaningful visualizations and insights for:
EXECUTIVE KPIs
Sales & Marketing
Operations Performance Tracking
Company Financial Performance
Media Reach & SEntinment
Customer Experience (CX) Reports
Automated Reporting
Clients often face demands, either externally or internally, to provide regular reports to their stakeholders. We can help you automate this process with regularly scheduled reports, packaged and sent to you by email on a month, weekly, or even daily basis.

Reporting Dashboard Platforms
Our team is experienced in leading data visualization platforms and select the right solution for your application:
Research Insights
Holland Aquatic Center Millage Campaign Research
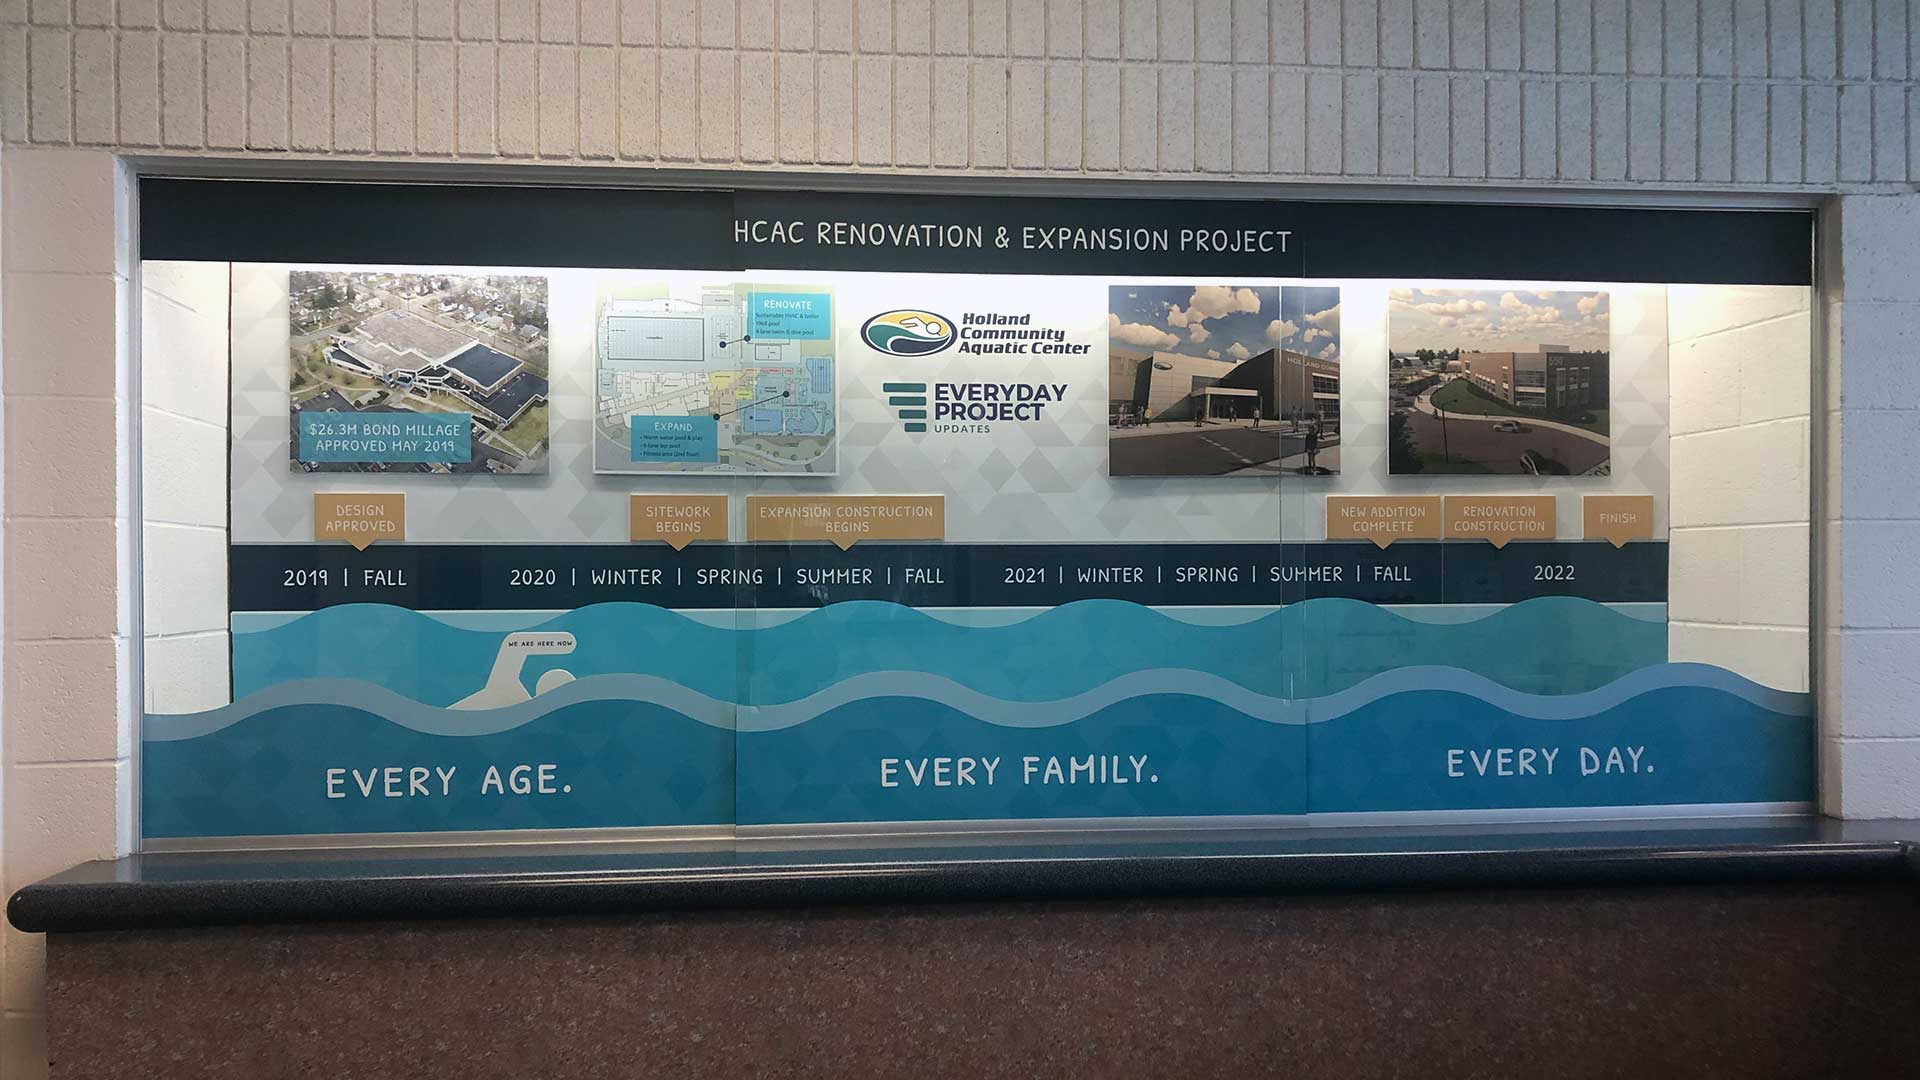
The Challenge After years of growth at Holland Community Aquatic Center (HCAC), simultaneous use by competitive programming and public access to their pools was becoming a capacity problem. They determined that a renovation of the existing facility and an expansion...

New Product Pricing & Market Feasibility Study
New Product Pricing & Market Feasibility Study Before you reconfigure your factory, invest in new equipment or change work processes, it can be beneficial to conduct qualitative and quantitative market research to understand if your new product idea is feasible....

Employee Experience (EX) Solutions for an Automation Company
Background & SUMMARY An automation solutions provider approached our team with an employee experience challenge. Providing the advanced solutions you’ll find in the facilities of major national brands, our client’s employees work in high-stakes environments with...
Visualize Your Data
Contact us to get started on your next dashboard or data visualization project. Give us a call at (616) 786-4461. Or send us an email to get started. We’d love an opportunity to hear about your organization might benefit from data dashboards or a custom report.